AI for e-commerce · July 18, 2026 · 9 min read
AI inventory forecasting for e-commerce: reduce stockouts without guessing


Inventory is where a forecast becomes cash. Order too little and a campaign creates stockouts. Order too much and capital sits in slow-moving sizes, colors, or locations. AI can help, but only if the store separates prediction from the decision to buy.
A forecast estimates demand. Replenishment decides what to order, when, and where. Confusing them makes it hard to learn from mistakes.
AI inventory forecasting for e-commerce predicts future demand by SKU, time, and location from sales history plus signals such as seasonality, promotions, price, returns, stockouts, and supplier lead times. Use it to compare scenarios and flag risk—not as an unquestioned purchase order. Track forecast error and bias, then apply explicit safety-stock, service-level, cash, and supplier rules.
Quick take
- Forecasting is not replenishment: prediction comes first; purchasing rules turn it into an order.
- Stockout data is censored: zero sales while unavailable does not mean zero demand.
- Aggregate accuracy can hide SKU failures: evaluate important products, variants, locations, and horizons separately.
- Bias matters: a model that consistently over-forecasts ties up cash even if average error looks acceptable.
- Humans own exceptions: launches, viral moments, supplier changes, and discontinued products need explicit overrides.

What is AI inventory forecasting?
Inventory forecasting estimates future unit demand for a product, variant, category, location, and time horizon. AI or machine-learning methods can model nonlinear interactions and many related series, while simpler statistical methods may work better for stable products with limited data.
The output might be a point forecast—42 units next week—or a range with uncertainty. The range is often more useful because a buyer can see the difference between steady demand and a highly uncertain estimate with the same midpoint.
Shopify's July 2026 overview of e-commerce inventory management lists history, seasonality, promotion calendars, market dynamics, behavior, supplier lead times, and returns among the inputs used by AI demand-forecasting tools. It also notes that velocity, sell-through, and margin matter beyond a simple bestseller label.
How is demand forecasting different from replenishment?
| Forecasting asks | Replenishment asks |
|---|---|
| How many units might customers want? | When should we place an order? |
| How uncertain is that estimate? | How much safety stock is justified? |
| Which SKUs or locations may change? | Which supplier, warehouse, or transfer should supply them? |
| What happens under a promotion scenario? | Can cash, storage, MOQ, and lead time support it? |
Forecasting produces evidence. Replenishment combines that evidence with current stock, open purchase orders, lead time, minimum order quantity, case packs, shelf life, storage, service-level target, and cash.
Keep both outputs. If a purchase creates excess stock, you need to know whether demand was overestimated, lead time changed, a minimum order forced the quantity, or someone overrode the recommendation.
What data does an AI forecast need?
Start with a clean time series of units sold by SKU and location, but add the context that explains it:
- availability and stockout periods;
- price, discounts, and promotion dates;
- product launches and discontinuations;
- returns and cancellations;
- supplier lead time and variability;
- channel and location;
- holidays, seasonality, and campaign calendar;
- product hierarchy, attributes, and substitutes;
- exceptional events recorded as events, not buried in notes.
Sales are not always demand. If a size was unavailable for three weeks, recorded sales understate what customers wanted. If a deep discount cleared old stock, those units should not automatically become the new baseline.
Which forecasting method should a store use?
Use complexity only when it improves out-of-sample decisions.
Baselines
Last period, moving averages, and seasonal comparisons are essential. They are easy to explain and reveal whether an advanced model adds value. Never evaluate AI without a sensible baseline.
Statistical time-series models
These can model trend and seasonality well for products with sufficient stable history. They may struggle with sparse, intermittent demand or fast assortment changes unless adapted.
Machine-learning models
Tree-based or neural models can combine price, promotions, product relationships, location, and many series. They require disciplined training, leakage prevention, and monitoring. More inputs do not guarantee a better forecast.
Hierarchical and grouped forecasts
Forecasts exist at SKU, category, location, and total-store levels. Good systems reconcile them so parts add up sensibly. A category forecast can also help cold-start a new variant when its own history is short.
Human scenarios
Buyers know about an upcoming influencer campaign, supplier issue, or packaging change before it appears in data. Capture the scenario and override reason separately so the team can later see whether the adjustment helped.
How does a forecast become an inventory decision?
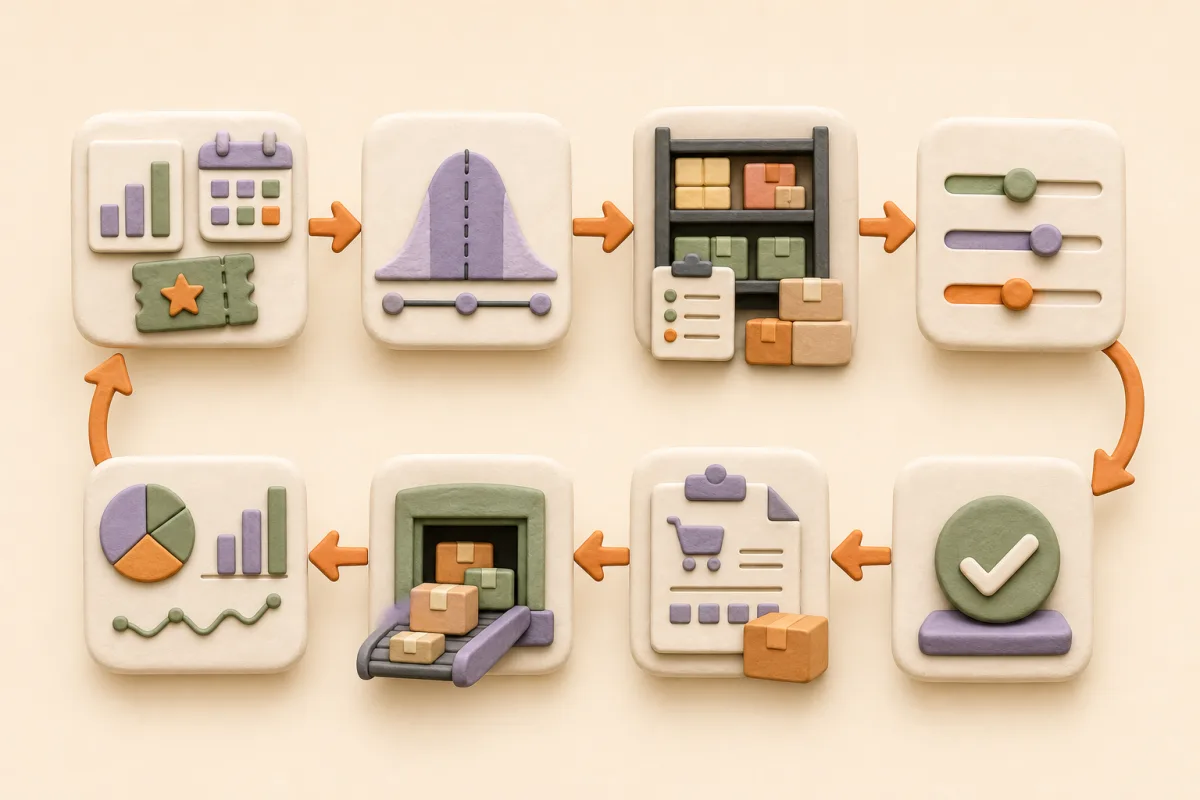
Use this sequence:
- Prepare demand history. Mark stockouts, returns, promotions, and lifecycle changes.
- Generate a forecast range. Produce expected demand plus uncertainty for the chosen horizon.
- Calculate inventory position. On hand + inbound − committed − unavailable.
- Apply replenishment policy. Lead-time demand, safety stock, service level, MOQ, packs, capacity, and cash.
- Review exceptions. High-value, new, volatile, expiring, or strategically important products receive human attention.
- Create approved orders or transfers. Preserve forecast version, policy, and override reason.
- Compare with reality. Feed actual demand, stockouts, delays, and overrides into the next review.
Automation should initially prepare recommendations and exception lists. Auto-order only stable, low-risk items after the policy has been tested through different demand conditions.
How do you measure forecast quality?
No single metric tells the whole story.
- MAE: average absolute unit error; intuitive but large sellers dominate.
- WAPE: total absolute error divided by total actual demand; useful across a portfolio, but weak when demand is near zero.
- Bias: whether the forecast systematically runs high or low.
- Service level or fill rate: whether demand was served when it occurred.
- Stockout rate: availability failures, interpreted alongside lost-demand estimates.
- Excess and aged stock: the cash and storage consequence of over-forecasting.
- Forecast value added: whether each adjustment or model improved the baseline.
Slice by revenue tier, product lifecycle, variability, location, and forecast horizon. A strong total forecast can still fail on the variants customers need.
How should you forecast new products?
New products have no direct history. Use:
- comparable products with similar price, category, audience, and launch channel;
- category seasonality and total demand;
- preorder, waitlist, search, and campaign signals;
- a conservative initial buy plus faster review cadence;
- scenario ranges instead of one confident number.
Do not let the launch plan leak into the evaluation. If the model is trained or tuned on the target someone hopes to sell, it may reproduce ambition rather than demand.
For fashion or size-heavy catalogs, forecast at the style level first, then allocate to variants with evidence and uncertainty. A perfect style total can still produce stockouts if the size curve is wrong.
What should Shopify merchants know in 2026?
Shopify says its reports can support order and inventory forecasting, and Sidekick can query store data for analysis. A timely platform change matters too: Shopify's help center says the Stocky app will no longer be available after August 31, 2026, and merchants using it should transition to Shopify's inventory-management features. Check the current Stocky migration guidance before building a new forecasting workflow around it.
Whatever tool you use, export historical data and document forecast logic, overrides, supplier settings, and KPI definitions. Portability matters because inventory decisions outlive software subscriptions.
What mistakes make AI inventory forecasting fail?
- treating unavailable periods as genuine low demand;
- training on cancellations or returns without consistent treatment;
- ignoring promotions, price, product lifecycle, or supplier changes;
- optimizing average error while overlooking systematic bias;
- evaluating only total store demand;
- using one horizon for every decision;
- auto-ordering before exception rules are proven;
- leaving buyer overrides undocumented;
- trusting a visually impressive dashboard without a baseline.
Better forecasting also improves the customer experience. Fewer stockouts mean fewer failed recommendations, backorders, and “where is my order?” conversations, especially around Black Friday peaks.
Frequently asked questions
What is AI inventory forecasting?
AI inventory forecasting uses statistical or machine-learning models to estimate future demand by product, variant, time, and location. It can combine sales history with seasonality, price, promotions, stockouts, returns, product attributes, lead times, and other signals. The forecast informs inventory policy; it should not automatically become a purchase order.
How much sales history do I need?
It depends on seasonality, product lifecycle, and data granularity. A few consistent weeks can support basic operational planning, while annual seasonality requires at least a full cycle and preferably more. New products need comparable-item and category signals plus wider uncertainty. Always compare with a simple baseline.
Can AI prevent all stockouts?
No. Forecasts cannot eliminate supplier delays, viral demand, data errors, or genuinely unpredictable events. A store also chooses its service level based on margin, cash, shelf life, and risk. AI can improve visibility and decisions, but safety stock, supplier management, scenarios, and human exceptions remain necessary.
What is the difference between a forecast and a reorder point?
A forecast estimates demand over a future period. A reorder point is an inventory threshold that triggers replenishment, usually based on expected demand during lead time plus safety stock. Forecasting supplies one input; the reorder policy also accounts for inventory position, lead-time variability, service level, and operational constraints.
Which metric is best for inventory forecasting?
Use several. WAPE or MAE describes error, bias shows systematic over- or under-forecasting, and fill rate, stockouts, aged stock, and cash tied up reveal business consequences. Segment results by SKU importance, lifecycle, location, and horizon so strong aggregate numbers do not hide important failures.
Should a small store use AI or a spreadsheet?
A clean spreadsheet with seasonal baselines, lead times, and documented assumptions may outperform an advanced tool when data is limited. Consider AI when the assortment, locations, signals, or update frequency exceed manual capacity. Keep the spreadsheet baseline so you can verify that the model actually adds forecast value.
Can AI automatically place purchase orders?
It can, but full automation should come after a long suggestion-mode period. Start with recommended quantities and exception review. Auto-order only stable, low-risk products under explicit spend, MOQ, supplier, lead-time, and inventory limits. Preserve approvals, model version, forecast, policy, and rollback or cancellation procedures.